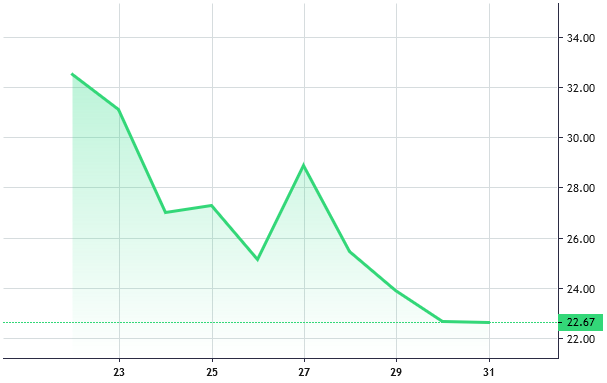
面积图系列
面积图是另一种显示量化数据的方式。 它连接所有的数据点和时间轴并使用颜色标明。
数据系列区域会显示十字准星线 - 沿着系列线移动的圆形标记,同时光标沿着时间刻度在图表上移动。

如何创建面积系列
const areaSeries = chart.addAreaSeries();

// set the data
areaSeries.setData([
  { time: "2018-12-22", value: 32.51 },
  { time: "2018-12-23", value: 31.11 },
  { time: "2018-12-24", value: 27.02 },
  { time: "2018-12-25", value: 27.32 },
  { time: "2018-12-26", value: 25.17 },
  { time: "2018-12-27", value: 28.89 },
  { time: "2018-12-28", value: 25.46 },
  { time: "2018-12-29", value: 23.92 },
  { time: "2018-12-30", value: 22.68 },
  { time: "2018-12-31", value: 22.67 }
]);
数据格式
每个面积系列项应具有以下字段:
time(时间) - 项目时间value(number) - 项目值
定制
面积系列的上面一行提供了颜色、样式、宽度的设置选项。a series.
可以为面积的上面和下面设置不同的颜色。 这些颜色在该区域的中间互相融合。
另外,默认情况下启用的十字准星线可以被禁用或调整其半径。
可以使用以下选项,自定义面积系列:
| 名称 | 类型 | 默认值 | 描述 |
|---|---|---|---|
topColor |
string |
rgba(46, 220, 135, 0.4) |
面积上面颜色 |
bottomColor |
string |
rgba(40, 221, 100, 0) |
面积下面颜色 |
lineColor |
string |
#33D778 |
线的颜色 |
lineStyle |
线的样式 | LineStyle.Solid |
线的样式 |
lineWidth |
number |
3 |
线宽(像素) |
crosshairMarkerVisible |
boolean |
true |
如果为 true,则显示十字准星线 |
crosshairMarkerRadius |
number |
4 |
十字标记的半径(以像素为单位) |
例子
设置面积系列的初始选项:
const areaSeries = chart.addAreaSeries({
  topColor: "rgba(21, 146, 230, 0.4)",
  bottomColor: "rgba(21, 146, 230, 0)",
  lineColor: "rgba(21, 146, 230, 1)",
  lineStyle: 0,
  lineWidth: 3,
  crosshairMarkerVisible: false,
  crosshairMarkerRadius: 3
});
创建系列后更改选项:
// 例如,让我们仅覆盖线宽和颜色
areaSeries.applyOptions({
  lineColor: "rgba(255, 44, 128, 1)",
  lineWidth: 1
});